As a project manager, you know that, generally, when a project is heading towards a fall, you’re the one who’s going to bear the brunt of the impact. But is it really the project manager’s fault? Sometimes, maybe. But in 95% of software projects a lot of things went wrong, even before the project manager came into the picture. Let's talk about the problem, and a possible helpful method: Value Stream Mapping
What kinds of things go wrong? In most cases, there’s a deadline for the completion of the software project from the very beginning. But the scope of the project is not adequately defined, which makes it very difficult for the project manager to meet expectations. If the requirements are subject to interpretation, you can expect this to be a problem.
We have seen countless examples of projects that seemingly started out on the right track. In the initial phase, the analysts and developers had their hands full, and the testers were validating features at a breakneck pace. Until the deadline started approaching and they had to pick up the pace.
Pressure's coming up, and project managers began sounding alarm bells because it didn’t look like they were going to make the deadline. Frustration, panic responses, and finger-pointing followed. The shit hits the fan.
“We need to add more developers, so we can deliver faster,” is generally the next move. But is the solution really extra resources? Or is it process optimization?
Standing still is moving backwards
Very often, we see project managers focusing on measuring development speed. But we’ve found that this automatically creates a blind spot that ignores something critical about the software delivery process.
We started to think that perhaps we should start looking at the time in which things don't happen, rather than the time in which they do. When we did, one figure kept jumping out at us.
We turned to Value Stream Mapping, a method from the Lean Manufacturing methodology. This technique enabled us to analyze and visualize software delivery tracks, bottlenecks and value. The biggest revelation we learned from this exercise? Finding out where we have loss of efficiency and the obstacles of a project?
Below, we show an example of what Value Stream Mapping looks like in practice:
Blue = Average “active” time (working time)
Yellow = Average “passive” time, or time in which no work is being done on a task
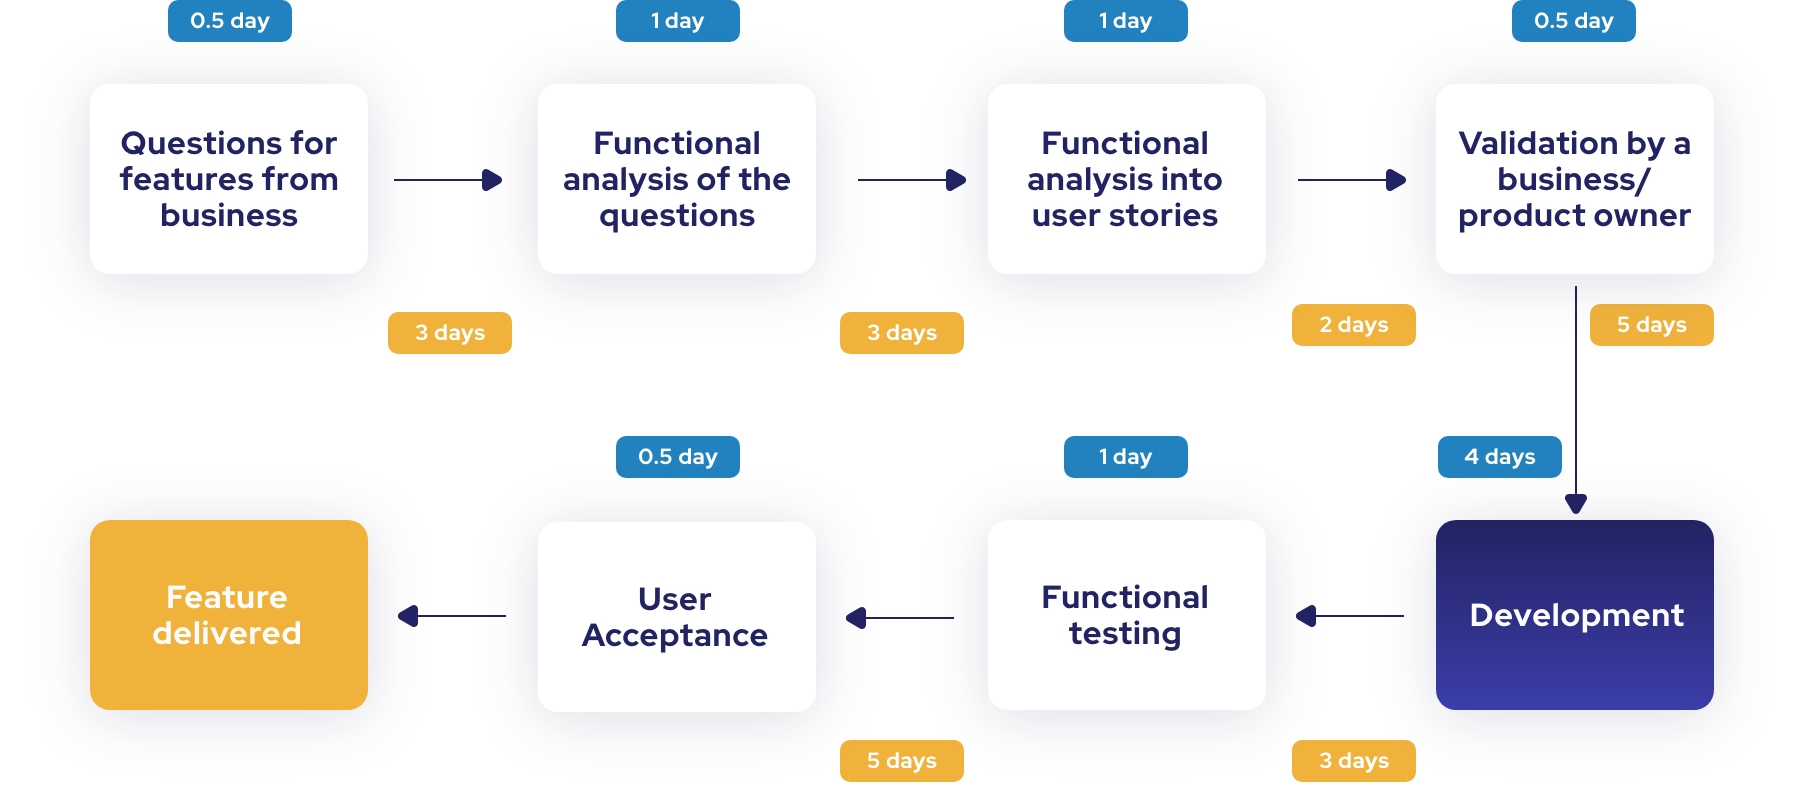
- Total time from request to completion: 29.5 days
- Effectively worked time: 8.5 days
- Downtime (= lost time): 21 days
- Efficiency (worked time/total time): 29%
We think this figure is jaw-dropping
– don’t you? It also shows that additional developers won't help in situations like this. The real problem? The time lost to “doing nothing”, not the number of resources “working” on the project at any given time. That’s why our advice is: strive for more efficiency from day 1. That’s how you will actually get the most out of your resources, without eating up your budget and manpower.
Does this example look familiar to you – maybe like one of your projects? Talk to us, and together we'll tackle the problem at the roots and get your project moving again.